
Studio notes
Risk Management and Position Sizing: Know What You Can Lose Before You Enter a Trade
Size every trade with the 1–2% rule and an ATR-based stop. Worked stock and forex examples, effective leverage, and why full Kelly is dangerous for retail traders.
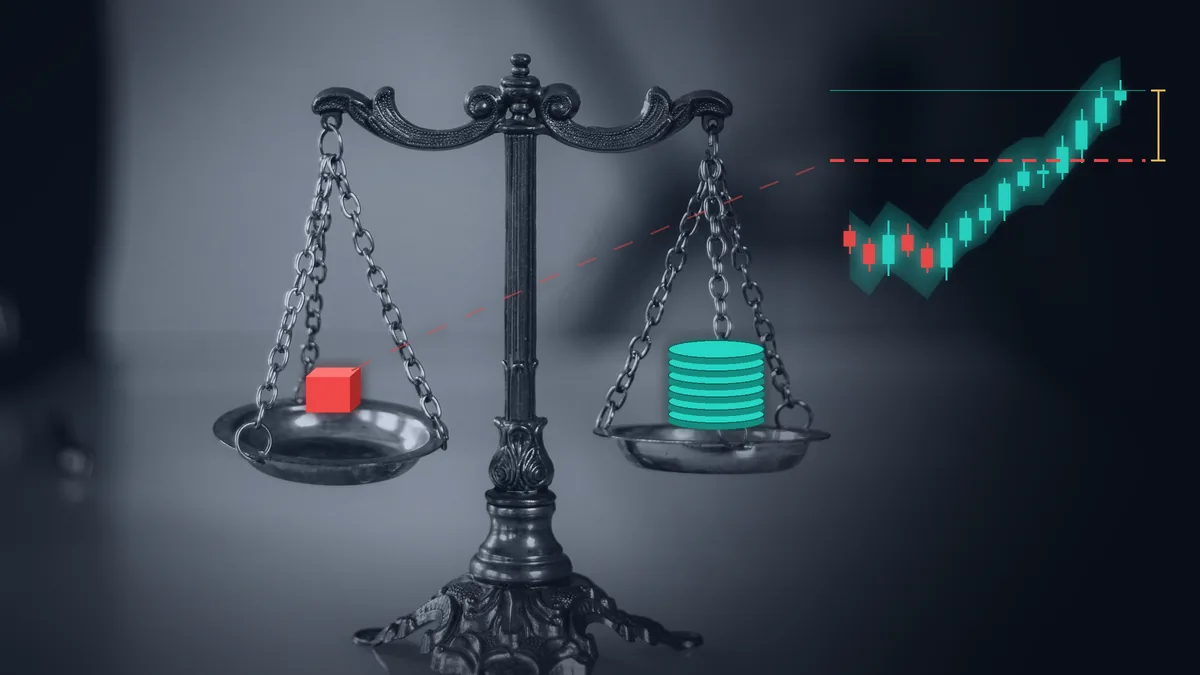
Most new traders spend their energy on entries: which indicator, which pattern, which signal. The question that actually decides whether an account survives is plainer and far less exciting: "If this trade is wrong, how much do I lose?"
The numbers back this up. When the European Securities and Markets Authority (ESMA) restricted CFDs for retail clients in 2018, national regulators' analyses showed that 74–89% of retail accounts typically lost money on them. ESMA pointed to "excessive leverage" as a defining problem, not a shortage of good indicators.
This guide is for retail traders in forex, stocks or crypto, trading by hand or with a bot. Using a few simple formulas and worked numbers, we will size each trade so that one mistake, or even ten in a row, does not knock the account out of the game. Every number here was calculated and checked with a Python script. This is education, not investment advice or a promise of returns.
Why big losses are so expensive
Start with the arithmetic. Lose 50% of an account and you need a 100% gain, not 50%, to get back to where you started, because the next gain is earned on a smaller base.
| Drawdown | Gain needed to recover |
|---|---|
| 10% | 11.1% |
| 20% | 25% |
| 30% | 42.9% |
| 40% | 66.7% |
| 50% | 100% |
| 75% | 300% |
The formula is L ÷ (1 − L), where L is the loss. Up to about 20%, recovery is realistic. Beyond that the curve steepens fast. So the first job of risk management is not to make more money. It is to never reach the steep part of this table.
The 1–2% rule: cap the risk, not the position
The well-known rule says: never risk more than 1–2% of the account on a single trade. It is a convention among traders, not a scientific law or a regulator's requirement, but the logic behind it is sound.
The key point is that "risk" means the amount you lose if your stop is hit, not the size of the position. With a $10,000 account and 1% risk, you can buy about $1,550 worth of stock, as long as the distance from entry to stop means that a stop-out costs you about $100.
Why so small? Because losing streaks are more normal than they feel. Say your strategy wins 45% of the time. Over 250 trades, the chance of at least one run of 8 straight losses is about 61%. The chance of 10 in a row is about 24%. Those are ordinary odds, not a doomsday scenario. Here is what 8 straight losses do at different risk levels:
| Risk per trade | Drawdown after 8 straight losses | After 12 straight losses |
|---|---|---|
| 1% | 7.7% | 11.4% |
| 2% | 14.9% | 21.5% |
| 5% | 33.7% | 46% |
| 10% | 57% | 71.8% |
At 1%, a normal bad patch is an uncomfortable but survivable dip. At 10%, the same patch puts you in the part of the recovery table you rarely climb out of. And that is only the maths; a trader who has just lost 40% of the account rarely makes the next decision calmly.
Let volatility set the stop, not your comfort: ATR
A common mistake is to pick the position size first and then put the stop wherever the loss feels "acceptable". The result is a stop that has nothing to do with how the market moves. Too tight, and normal noise takes you out. Too wide, and the loss is bigger than it needs to be.
Do it the other way round: set the stop from the market first, then derive the size from it.
One of the simplest tools for this is the Average True Range (ATR), introduced by J. Welles Wilder in his 1978 book New Concepts in Technical Trading Systems. As StockCharts explains, each bar's true range is the largest of:
- the bar's high minus its low;
- the distance from the high to the previous close;
- the distance from the low to the previous close.
The last two make sure price gaps count as volatility. ATR is a smoothed average of the true range, usually over 14 periods. It says nothing about direction; it only tells you how far price typically travels in one bar.
A common approach is to place the stop a multiple of ATR away from entry. Multiples between 1.5 and 3 are widely used, but there is no magic number. The right multiple depends on your timeframe and strategy, and you should check it against your own data. The nice side effect is that in a volatile market the stop automatically widens and the position shrinks, and in a quiet market the opposite happens.
The position sizing formula
It all comes down to one line:
Size = (account equity × risk %) ÷ (distance from entry to stop × value of one unit of price movement)
The top tells you how much money you are willing to lose. The bottom tells you how much one unit of the asset loses if the stop is hit. Always round the result down, never up.
Example 1: a stock
- Account equity: $10,000
- Risk per trade: 1%, or $100
- Entry price: $50.00
- 14-day ATR: $1.60
- Stop: 2 × ATR below entry, at $46.80 (a $3.20 distance)
Size = $100 ÷ $3.20 = 31.25, rounded down to 31 shares. The position is worth $1,550, about 15.5% of the account. If the stop is hit, you lose $99.20, plus commission and slippage.
A warning for markets with daily price limits, trading halts or thin order books: if a stock locks limit-down or simply has no buyers, your stop will not fill, and the real loss can be several times the planned one. In those markets, treat liquidity as part of the risk and size more conservatively.
Example 2: forex, EUR/USD
Forex size is measured in lots. A standard lot is 100,000 units of the base currency. On pairs quoted in US dollars, such as EUR/USD, one pip (0.0001) on a standard lot is worth $10. A mini lot (0.1) is worth $1 a pip and a micro lot (0.01) 10 cents.
- Account equity: $5,000
- Risk per trade: 1%, or $50
- 14-day ATR: 72 pips
- Stop: 1.5 × ATR, or 108 pips
Size = $50 ÷ (108 × $10) = 0.046 lots, rounded down to 0.04 lots. If the stop is hit, the loss is $43.20, a little under the $50 cap. Rounding up to 0.05 lots would make it $54 and break your own rule.
Two notes for other pairs. On yen pairs such as USD/JPY, a pip is 0.01 and its dollar value depends on the yen rate. On crosses without the dollar, you have to convert the pip value into your account currency. The safest source for pip value and lot size is the contract specification in your broker's own platform.
The same formula in a few lines of code
If you size positions in a spreadsheet, a script or a trading bot, the logic is just this. We ran this function on both examples above and checked it with a few tests, including one that confirms the loss never exceeds the risk cap:
import math

def position_size(equity, risk_pct, entry, stop, value_per_point=1.0, step=1.0):
    """Size such that hitting the stop loses at most risk_pct of the account."""
    risk_cash = equity * risk_pct
    loss_per_unit = abs(entry - stop) * value_per_point
    if loss_per_unit == 0:
        raise ValueError("stop cannot equal entry")
    units = risk_cash / loss_per_unit
    return round(math.floor(units / step + 1e-9) * step, 8)

# Stock: $10,000 account, 1% risk, entry $50, ATR $1.60, stop at 2 x ATR
print(position_size(10_000, 0.01, 50.00, 50.00 - 2 * 1.60))         # 31.0
# Forex: $5,000 account, 1% risk, EUR/USD, 108-pip stop, 100,000 units per lot
print(position_size(5_000, 0.01, 1.1000, 1.0892, 100_000, 0.01))     # 0.04
step is the smallest size increment: 1 for shares, 0.01 lots for most forex accounts. Commission, spread and slippage are not included; if they are significant relative to your stop distance, add them to loss_per_unit.
Leverage is a ceiling, not a target
In the forex example, the notional value of 0.04 lots (€4,000) is about $4,400 at an assumed rate of 1.10. Your effective leverage is below 1, about 0.88×. Effective leverage is simply the notional value of all open positions divided by account equity.
Now take the same $5,000 account and open a full lot with the same stop. Notional value becomes $110,000 and effective leverage 22×. If the stop is hit, $1,080, or 21.6% of the account, is gone in one trade. The uncomfortable part is that nothing stops you. At 1:500 leverage the required margin is only $220, and even under Europe's 30:1 cap, $3,667 is enough.
Regulators cap leverage for retail accounts:
- European Union (ESMA, 2018 measures): 30:1 on major currency pairs; 20:1 on non-major pairs, gold and major indices; 10:1 on other commodities and non-major indices; 5:1 on individual shares; 2:1 on crypto. Plus a margin close-out when equity falls to 50% of required margin, and negative balance protection, so you cannot lose more than the account holds.
- United States (CFTC): under 17 CFR § 5.9, the minimum security deposit for retail forex is 2% of notional on major pairs (50:1) and 5% on others (20:1).
Brokers outside these regimes sometimes offer leverage in the hundreds. But leverage on offer is only a ceiling. How much you actually use should be decided by the position sizing formula.
One more limit to keep in mind: a stop does not guarantee your exit price. On a weekend gap, a surprise headline or in a thin market, the order fills at a worse price. That is where high leverage turns ordinary slippage into a disaster.
The Kelly criterion: the right formula, used dangerously
If 1–2% is only a convention, is there a scientific way to find the optimal size? The famous answer is the Kelly criterion. In 1956 John Kelly, a researcher at Bell Labs, showed in "A New Interpretation of Information Rate" what fraction of capital a bettor with an edge in a repeated bet should stake to achieve the fastest long-run growth.
For a trade with win probability p, loss probability q (= 1 − p) and a win-to-loss ratio b, the formula is:
f* = p − q ÷ b
Take a strategy that wins 45% of the time and makes 1.5 times on a win what it loses on a loss. Its expectancy is positive: on average each trade earns 0.125 times the amount risked. Kelly gives 0.45 − 0.55 ÷ 1.5 = 8.3% of capital per trade, four to eight times the 1–2% rule. So why don't professionals use it?
Problem one: even with exact inputs, the ride is brutal
Edward Thorp, who applied Kelly first to blackjack and later to running money, shows in his chapter on the criterion that at full Kelly the chance of capital at some point falling to half is 50%. At "half Kelly" that chance drops to one in eight (12.5%), while you keep three-quarters of the growth rate. (These figures come from Thorp's continuous approximation over an unlimited horizon.) Thorp writes that his own experience, and reports from many blackjack players, suggest most people strongly prefer the comfort of half Kelly or something near it, and accept giving up a quarter of the growth rate for it.
Problem two: you don't know p and b
In blackjack the odds can be calculated. In markets you estimate p and b from past data, and the estimate is almost always optimistic. Suppose the true win rate of that same strategy is 40%, not 45%. With the same 1.5 ratio, expectancy is exactly zero and so is the Kelly fraction. A trader risking 8.3% on the 45% estimate is, in reality, betting heavily on a game with no edge. Thorp makes the same point: overestimating the edge and overbetting is punished far more severely than underbetting.
The formula also assumes known, stable probabilities and independent outcomes, which markets rarely provide. So treat the Kelly fraction as a ceiling, not a target. A trader who works out Kelly and then takes a small fraction of it usually lands back in the 1–2% range.
A simulation: one strategy, four risk levels
To make this concrete, we simulated the same hypothetical strategy (45% win rate, 1.5 win-to-loss ratio) 20,000 times, 250 trades each, at four risk levels. "Drawdown from peak" is the largest fall from the account's previous high.
| Risk per trade | Median final equity | Chance of a 30% drawdown | Chance of a 50% drawdown | Chance of ever hitting half the starting capital |
|---|---|---|---|---|
| 1% | 1.36× | 0.6% | near zero | near zero |
| 2% | 1.77× | 25% | 0.9% | 0.3% |
| 4.2% (half Kelly) | 2.77× | 94% | 36% | 9% |
| 8.3% (full Kelly) | 4.01× | 100% | 97% | 41% |
The second column looks tempting. But it only holds if the win rate really is 45%. Here is the same simulation with a 40% win rate (zero expectancy):
| Risk per trade | Median final equity | Chance of a 50% drawdown | Chance of ever hitting half the starting capital |
|---|---|---|---|
| 1% | 0.98× | 0.1% | near zero |
| 2% | 0.93× | 16.5% | 9.3% |
| 4.2% | 0.73× | 80% | 51% |
| 8.3% | 0.28× | 99.9% | 85% |
At 1% risk, misjudging your edge costs you a wasted year. At full Kelly, it costs you most of the account. Small risk is insurance against your own estimation errors. The simulation ignores commission, spread and slippage and assumes independent trades; in the real world both assumptions make things worse.
A pre-trade checklist
- Set the stop from market structure or ATR before you think about size.
- Write down your risk cap: the share of the account you lose if the stop is hit. For most retail traders, 1% is a sensible starting point.
- Calculate the size and round down. Take pip value and lot size from your broker's contract specification.
- Add up the risk on all open positions. Three same-direction trades on correlated pairs such as EUR/USD and GBP/USD are effectively one bigger trade. Set a cap for total open risk too.
- Check effective leverage: notional divided by equity. If the number is large, ask whether your stop really is that tight or whether you made a mistake.
- Have a stop rule for yourself. For example, when you hit the daily or weekly loss limit you set, stop trading until the next period. The exact number is a matter of preference; having one is not.
If you run a trading bot
A bot is the best place to enforce these rules, provided that position sizing lives in the bot's code, separate from the signal logic, rather than as a fixed number in the settings. Before every order the bot should read the actual account equity, recompute ATR, build the size with the formula above, and reject the order if the result exceeds the risk cap or the allowed leverage. Our article "AI Agent Trading Bots: The Model Sends the Order, but You Own It" on this site shows how to build these checks as an independent gate in front of order submission.
The bottom line
A good entry decides your odds. Position size decides how many times you can be wrong and still be in the game. Take the stop from market volatility, then size the trade with a simple formula that caps each loss at 1–2% of the account. Treat leverage as a ceiling, not a target, and use Kelly only to understand the upper limit of risk. None of this guarantees a profit. It simply makes sure that if you do have a real edge, it gets the time to show itself.
If you run a trading bot or system and want help building or reviewing its position sizing, risk caps and pre-order checks, get in touch through the Order page on the Behvandi website.
This article is for educational purposes only and is not investment or trading advice. Leveraged trading can result in the loss of all your capital.
Comments
No comments yet. Be the first to write one.